Monitoring
How I combine Uptime Kuma, Beszel, Glances, and Dozzle to spot service failures, check server health, and investigate container logs across my homelab.
How I Keep Eyes on Everything
When a service fails, I want to know which layer is responsible. Is the application unreachable? Is its host under pressure? Did a container log an error? I use a small set of monitoring tools because each answers a different part of that question.
My homelab has seven servers. I keep Dozzle, Beszel, Glances, and Uptime Kuma running at the same time, but they are separate tools—not one integrated monitoring system. I use each for its own strengths, and a running monitoring container does not prove that it is receiving current data.
Uptime Kuma: is the service responding?
Uptime Kuma is my availability view. It tells me whether a check I set up can reach the service it watches. The monitor result is a useful starting point, not a diagnosis: a failed check tells me something is wrong along that path, but not whether the cause is the app, its host, a dependency, or the network.
The container runs on docker-vm, keeps its data in a persistent directory, and is attached to the local proxy network. I keep the monitor configuration in the application data rather than treating the container itself as the source of the checks.
Beszel: what is happening on each server?
Beszel collects server statistics through small agents installed on each monitored machine. The agents send data to the Beszel hub, the dashboard that gathers it. I have agents configured on docker-vm, d4rkcloud, and d4rkcloud-2. They use host networking and mount the Docker socket—the local interface for Docker—read-only to report host and container details.
There is an important check beyond docker ps: an agent container can be running while its connection to the hub is timing out or reconnecting. In the logs I checked on October 29, 2026, I saw connection retries. I treat current data in the hub—not just a running agent—as proof that monitoring is working.
Glances: a closer look at the local host
Glances gives me a live view of the server where it runs. In my setup, it is on docker-vm, and Homepage uses it to show CPU and memory. Glances has elevated access and can see host processes, so it can report system details; its Docker socket access is read-only.
That makes it useful when I need a closer look at the machine itself, but Glances only shows the host where it runs; it is not my multi-server view.
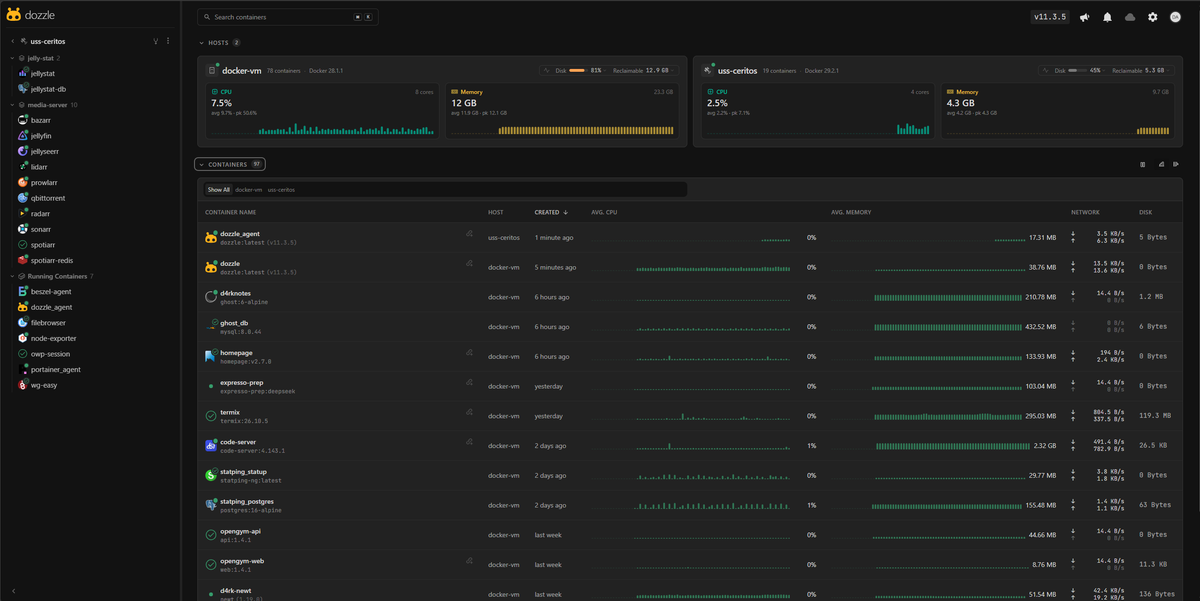
Dozzle: what did the containers log?
Dozzle gives me a place to inspect container logs. When an uptime check fails or a service behaves strangely, its logs can show the application error, a startup failure, or a dependency connection problem that a green or red status cannot explain.
My Dozzle container runs on docker-vm and reads that host’s Docker socket. That gives me a convenient log view for the containers it can see; it should not be mistaken for automatic log collection from every server.
Dozzle also has its own remote-agent mode, separate from Beszel’s agents. With a Dozzle agent running on a remote server and connected to the main Dozzle instance, that host’s containers can be viewed remotely. With container actions enabled, Dozzle can check for a newer image and update an eligible running container. It follows the exact tag the container already uses, so a moving tag can pick up a new image, but a pinned version tag will not be changed to a different version. Dozzle recreates the container with its current configuration; it does not edit the Compose file, so this is a container update—not a replacement for changing the Compose source.
Each remote host needs its own Dozzle agent. The agent is powerful: anyone who can reach its port can read that host’s container logs and run commands inside its containers. I would keep the agent reachable only over the private network, such as Tailnet, rather than expose it publicly.
Separate tools, used at the same time
I do not use these as a handoff from one app to another, and they are not wired into one shared workflow. I keep them available at the same time and use the view that matches what I want to know.
- Uptime Kuma keeps checking whether its monitored services respond.
- Beszel gives me server and container metrics from the hosts whose agents are connected.
- Glances gives me a live, detailed view of the local
docker-vmhost. - Dozzle lets me inspect container logs on the Docker host it can see.
Those views complement one another because they answer different questions, not because the applications form one integrated system. I play to each tool’s strengths and compare the signals when I am investigating a problem.
Monitoring coverage
Beszel agents are configured on docker-vm, d4rkcloud, and d4rkcloud-2. I SSH into the other servers when I need to investigate them. Dozzle, Glances, and Uptime Kuma run on docker-vm.
I keep the tools running at the same time and use each for its own strengths. I choose the view that fits the question—service availability, server metrics, local host detail, or container logs—rather than treating the apps as one integrated system.